HIDALGO / AUGUST 2026
8.86 monthsBack to the deal roomThe RioPlex
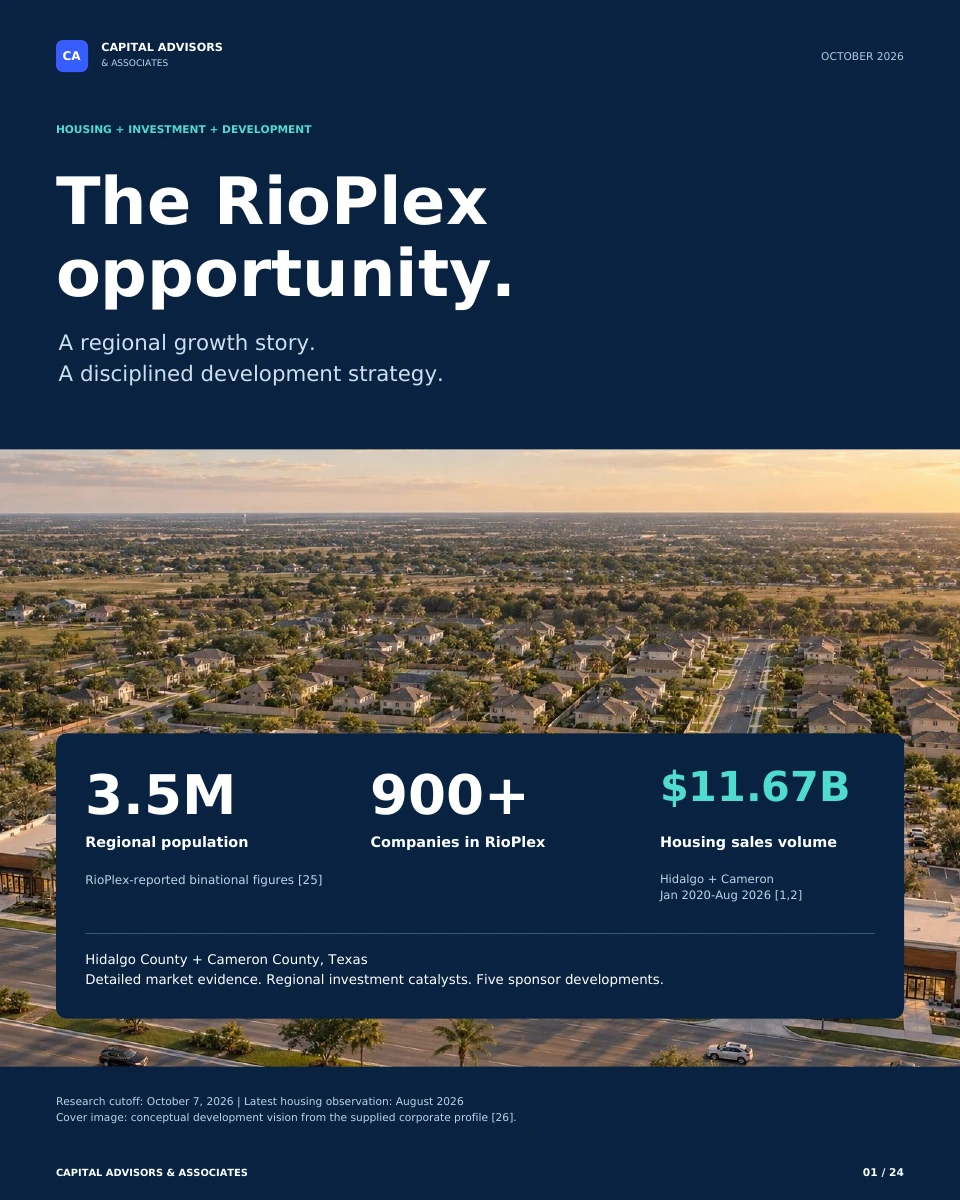 EXPLORE THE COMPLETE BOOKLET
MARKET INTELLIGENCE / OCTOBER 2026
The RioPlex
opportunity.
A regional growth story.
A disciplined development strategy.
Explore the housing evidence, regional investment and local execution behind our South Texas development thesis.
22 pages · Research cutoff: October 7, 2026
Latest housing observation: August 2026
EXPLORE THE COMPLETE BOOKLET 45,668MLS-recorded home sales
Hidalgo + Cameron · Jan 2020–Aug 2026
Hidalgo + Cameron · Jan 2020–Aug 2026
$11.67BClosed-sale dollar volume
Same two counties and period
Same two counties and period
3.5MRioPlex-reported population
Broader binational region
Broader binational region
900+RioPlex-reported companies
Broader binational region
Broader binational region
Figures from the supplied study, pages 1–6. RioPlex’s population base year and company-count method are not specified. County housing activity is separate from sponsor performance.
01 / THE HOUSING EVIDENCE
A market that
already transacts.
Explore six complete years of MLS-recorded housing activity. Choose a geography and measure; the 2026 snapshot is shown separately to keep the periods comparable.
Geography
Measure
Hidalgo + Cameron · Closed-sale volume
FULL YEARS / 2020–2025JANUARY–AUGUST 2026
$1,369.10M+7.0% versus January–August 2025Hidalgo + Cameron: 4,829 recorded sales and $1,369.10M in closed-sale volume. Partial-year observations are excluded from the full-year chart.
View the annual data table
| Year | Recorded sales | Dollar volume |
|---|---|---|
| 2020 | 6,781 | $1,334.75M |
| 2021 | 7,404 | $1,757.68M |
| 2022 | 6,867 | $1,764.21M |
| 2023 | 6,347 | $1,719.53M |
| 2024 | 6,587 | $1,804.93M |
| 2025 | 6,853 | $1,922.54M |
Read the record in context.
MLS data excludes off-MLS builder sales and private transactions. Sales are transactions, not unique homes. Dollar volume is nominal and reflects prices, product mix and transaction counts; it is not an appreciation index. Displayed county dollar figures are rounded and may not sum exactly to the combined figures.
Source: supplied market study, housing evidence on pages 6–9; Texas Real Estate Research Center at Texas A&M University.
CAMERON / AUGUST 2026
6.72 monthsHousing inventory
Growth calls for discipline.
Inventory expanded alongside higher prices. The study supports realistic sellout periods, attainable pricing and phased releases—not a blanket countywide housing-shortage claim.
02 / THE CONNECTED REGION
One region.
Two housing markets.
Hidalgo and Cameron form the study’s housing market. Starr, Willacy and northern Tamaulipas provide the wider regional context.
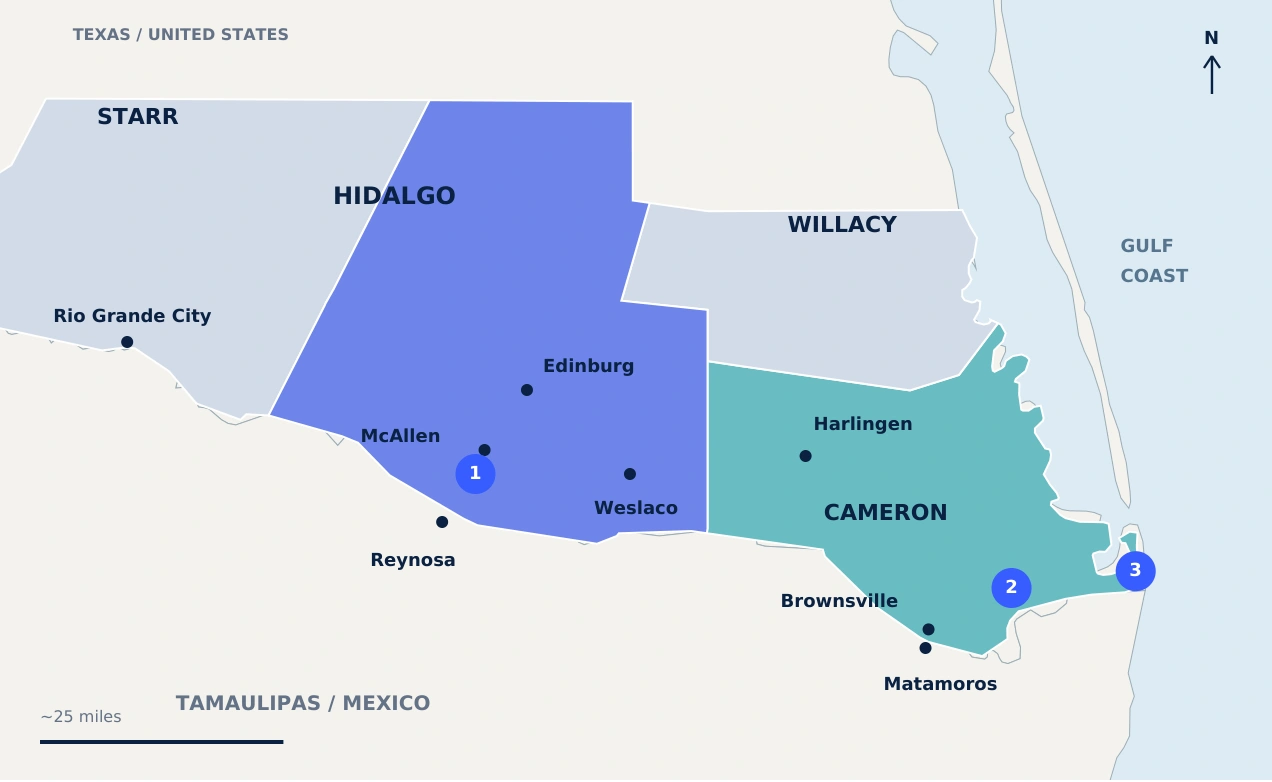
McAllen / Hidalgo
Manufacturing and healthcare, including Valeo and UT Health RGV.
Brownsville / Port
Maritime and LNG investment, including Port Alpha and Rio Grande LNG.
Starbase / Coast
SpaceX infrastructure and aerospace activity in Cameron County.
75Industrial parks
13International bridges
7Airports
3Seaports
Source: supplied market study, regional map and RioPlex-reported indicators on pages 3–4.
03 / INVESTMENT CATALYSTS
From announcements
to execution.
Selected milestones documented in the October 7 study. Project budgets, historical investment and projected jobs describe different measures and are not added together.
Rio Grande LNG
5 trainsThe study cites NextDecade’s July 2026 update reporting five trains under construction, with first LNG targeted for the first half of 2027.
Read the energy analysisSaronic / Port Alpha
$3.2BAnnounced shipyard investment, with a 2028 operating target. September’s groundbreaking announcement cited up to 10,000 projected jobs.
Read the coastal overviewValeo / McAllen
$225MA high-tech manufacturing plant with up to 500 projected jobs. The March 2026 groundbreaking announcement targets production in late 2027.
Read the Hidalgo overviewUT Health RGV
$145M+Approved funding for the Cancer and Surgery Center, which held its grand opening in October 2025. The center adds specialized care, research and training capacity.
Read the healthcare overviewSource: supplied market study, investment milestones and reporting on pages 10–14; underlying references are included in the booklet.
04 / WHY WE DEVELOP HERE
Regional conviction.
Project-level discipline.
The regional story creates a reason to investigate. A buildable, financeable community requires local evidence and coordinated execution.
Start with an achievable basis.
Match land cost and infrastructure per lot to buyer budgets and financing capacity.
Connect jobs with everyday living.
Validate commute patterns, utilities and access for each individual site.
Create value through delivery.
Coordinate land control, approvals, engineering and infrastructure. Keep the plan viable under flat resale prices.
Phase capital to evidence.
Use qualified buyers, builder interest and net sales after cancellations to guide releases.
Jobs do not translate one-for-one into new homes. Local hiring, commuting, temporary workers and existing housing all affect demand. Source: supplied study, pages 15–18; sponsor strategy and analytical conclusions.
Explore the project opportunities05 / READ THE COMPLETE STUDY
Examine the evidence.
Download the original booklet for the full housing record, regional map, investment coverage, development program and source register.
Housing & demographicsRegional investmentFive sponsor developmentsPublic-source references
Capital Advisors
RioPlex Market Study
22 pages · October 2026
Research cutoff: October 7, 2026
Housing observations through August 2026
About the data and source material
This page summarizes the supplied booklet as of its research cutoff. It is not a live market feed. Housing observations come from the Texas Real Estate Research Center; demographics are attributed to U.S. Census Bureau data; regional indicators are attributed to RioPlex. The booklet’s source register links the underlying public sources.
Annual charts use full calendar years 2020–2025. January–August 2026 observations are shown separately and compared with the same eight months in 2025. Investment announcements and projected jobs retain their stated dates and definitions. Plans, forecasts and sponsor-reported programs require project-specific verification.
Regional growth does not establish an individual project’s approvals, value, absorption or investment return. Review the governing project documents and supporting diligence with the team.